http://mathworld.wolfram.com/ScatterDiagram.html
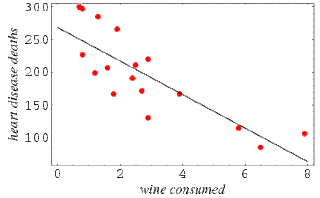
A scatterplot map displays information with two variables. Each set of information is displayed as a dot on the graph. this map shows the correlation between wine consumed and heart disease deaths.
A scatterplot map displays information with two variables. Each set of information is displayed as a dot on the graph. this map shows the correlation between wine consumed and heart disease deaths.

No comments:
Post a Comment