Karten fur mich
Tuesday, November 22, 2011
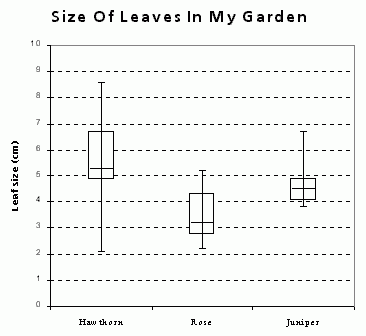
Box Plot
http://home.clara.net/dkeith/excel/box-plots.html
Box Plots are used to group data into five quadreds. They use a measure to show the 25% to the 75% percentile. Box Plots are excellent at finding averages and medians of data sets
No comments:
Post a Comment
Newer Post
Older Post
Home
Subscribe to:
Post Comments (Atom)
No comments:
Post a Comment